Diabetes Crisis Infographic
An infographic made to raise awareness of the U.S. Diabetes Crisis from the years 2000-2016.
Poster Dimensions: 13 in. x 35 in.
The crisis
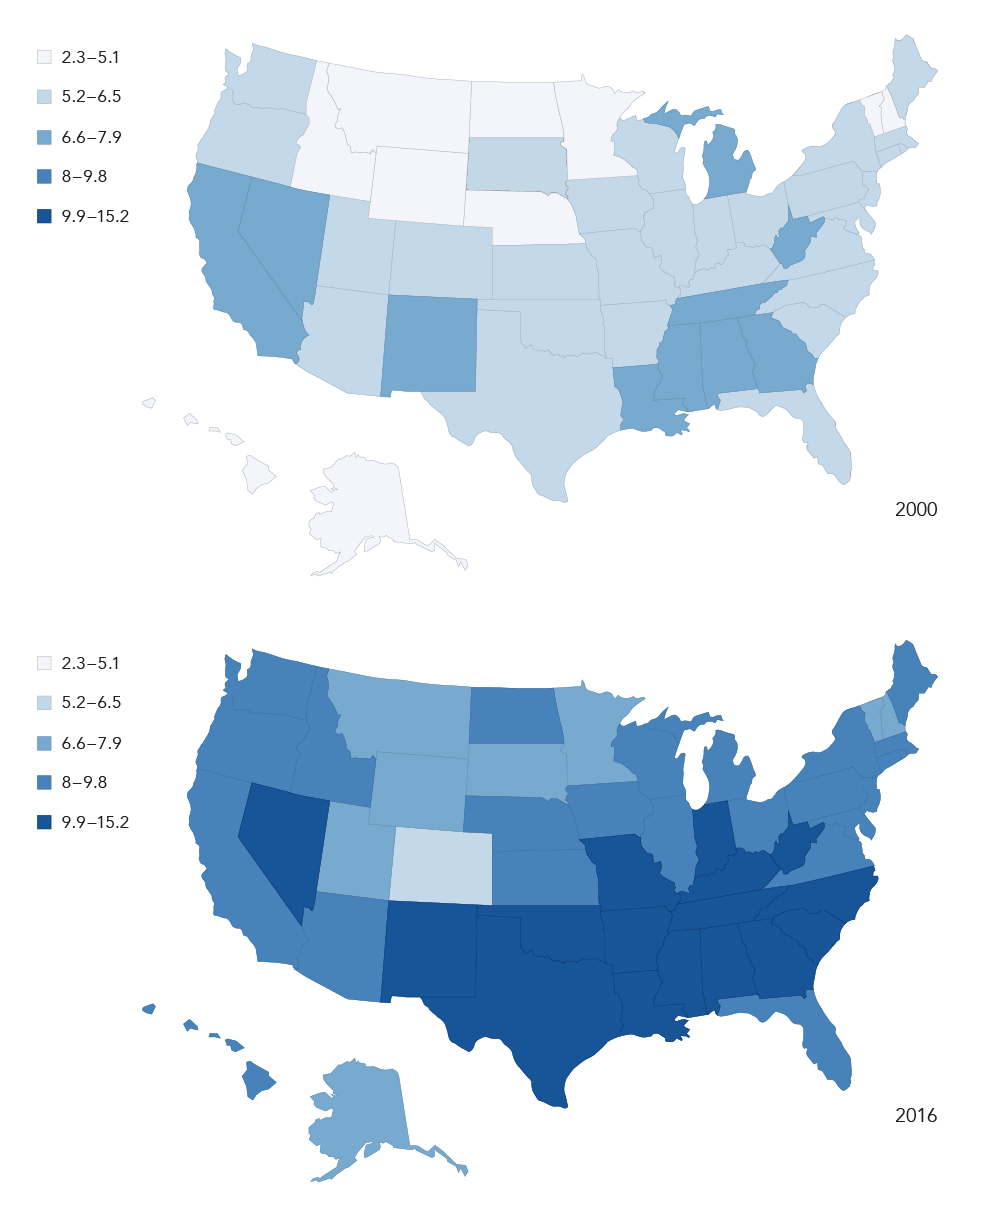
Diabetes has become one of the leading disabilities in the United States. The leading cause of Type 2 diabetes are a lack of physical activity and poor nutrition. As of 2016, this affected over 30 million Americans. With the rise of cases, I wanted to inform people of the statistics behind the growth and visually showcase how drastic the changes have been over the span of 16 years. This map shows the percentage of people diagnosed with diabetes by states in comparison from the year 2000 and 2016.
Age and wellness
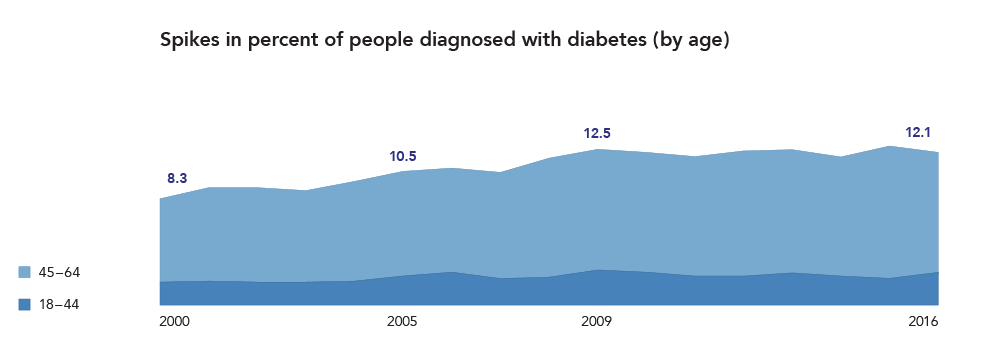
Type 2 is more commonly seen in people who are older due to the lack of activity and self care that is needed to maintain their health. Over the years, we have seen almost a 50% increase in both groups, causing concern for the well being of our future generations.
Education
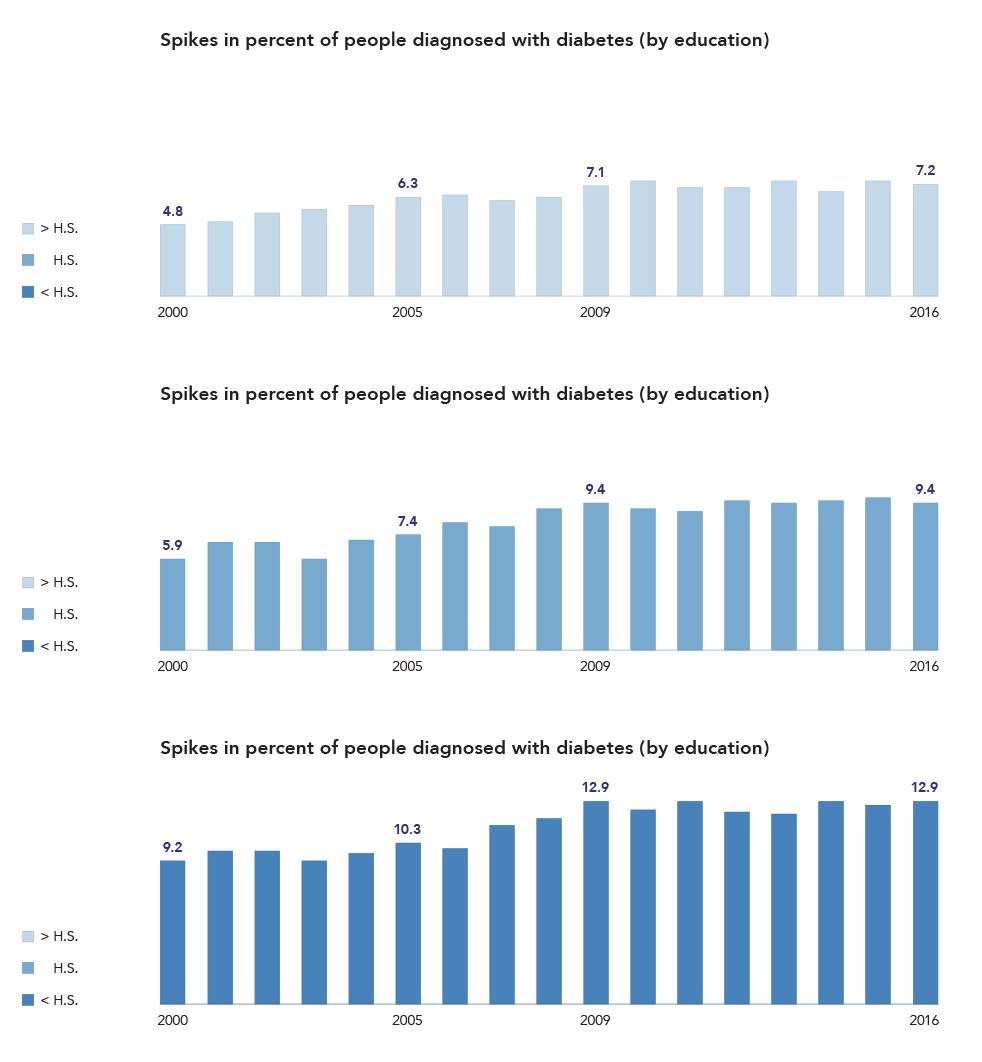
Being a factor for one’s well-being, lack of education was shown to increase the likelihood of developing Type 2 diabetes. Those who don’t complete a high school degree are nearly twice as likely to get it compared to those who receive a higher education.
Additional statistics
I went ahead and included some statistics in this case study that would show the individual the current percentages of where Type 2 lies in our nation.


